
A Framework for Transparency Program Planning and Assessment
Click or tap here to download a .pdf of this paper.
OBJECTIVES
I’m researching government program transparency in order to gain a better understanding of two related questions:
- How can we effectively and efficiently use technology to make the data associated with government programs more accessible and useful?
- How can we plan, measure, and improve the effectiveness and efficiency of government programs by making them more transparent?
APPROACH
To help answer these questions I am conducting interviews with association executives, think tank staff and researchers, government contractors, Federal agency CIO’s, and Congressional committee staff. I am also building and reviewing a reading list of resources and feeding my findings back into this article and others on this web site tagged with the term transparency. Figures 1 and 2 below show how I am organizing my thinking.
Figure 1, “Transparency Components,” displays the relationship among the different participants and transactions involved in government program transparency. This is intended to help us understand who is involved in government program transparency programs and how they relate to each other. It is also designed to help answer questions such as “Who pays?” and “Who benefits?”
Figure 2, “Framework of Transparency Program Planning Concepts,” displays an outline of the different concepts that need to be considered when planning and managing effective transparency programs. I’ll be revising this over time as I learn about the issues that should be considered, for example, when a given program’s current “transparency status” — and how to change it — need to be addressed through concrete action.
MY PERSPECTIVE
I support the practice of transparency for government programs. People need to know and understand how their tax dollars are spent. This seems to be something that both “liberals” and “conservatives” can agree with.
At the same time, transparency is not an end in itself. While data generated by a government program should be readily available and shareable among its target constituencies and members of the public, I also believe that resources devoted to improving the transparency of a government program should also promote the accomplishment of that program’s goals.
We need to understand the resources involved in making government programs transparent, especially when we consider “big data” and the new and innovative uses to be made of data generated by government programs. As I’ve noted elsewhere, transparency isn’t free. Someone has to pay for setting up and maintaining the web pages, databases, and services that are needed to make government program data accessible and usable. “Big” or not, the data have to exist before they can be sliced, diced, mashed up, analyzed, shared, and/or resold. For example, if program spending data need to be standardized before they can be sliced and diced analytically, someone needs to take responsibility for standardization efforts and for the resources necessary for storing, managing, updating, and analyzing the data.
At least some of that justification for all this effort must come from transparency’s support for the generating program itself, not just from a generalized goal that data should be accessible after the fact to track actual expenditures.
Expenditure and performance data should also be available to program management as close to real time as possible. That’s why I’m focusing here on what’s involved in planning and measuring the transparency of individual programs and what that might mean to how individual programs operate.
DEFINITIONS
Transparency is the practice of making the operation of government services visible and understandable to the people they are intended to serve — and to the people who design, manage, and evaluate the effects of these programs.
The management of data about these programs and how data are generated, shared, and distributed, are keys to improving transparency.
Since there are many different types of government programs, how transparency operates will differ from program to program. Elements of transparency include:
- Basic information about the nature of the service provided by the program and how to take advantage of the service is freely available in a form and language accessible to the program’s target populations.
- The identities and qualifications of the people responsible for managing and providing the service are available.
- The costs of operating and using the service are known and accessible to the public.
- Information on how to manage and operate the service is available to those responsible for doing so.
- Descriptive information (for example, transaction volumes by type of service) and evaluative information (e.g., internal and external performance audits, service response times, and user satisfaction) are available to those responsible for using, managing, and overseeing the service.
- Data generated by the program are available in a public and documented form that encourages oversight as well as innovative analysis and re-use of the data.
- There are many different ways to share such data including databases, computers, print and online publications, documents, networks, websites, software, audio and video programs, social networks, smartphones, and tablet computers.
QUESTIONS ABOUT TRANSPARENCY
While we want the transparency program itself to operate in an efficient and cost effective manner, the parent program that transparency supports must also be effective in accomplishing its objectives. In other words, making data about a program’s operation accessible is not by itself sufficient, even if that data can be shown to be useful to individuals or organizations other than the program’s target constituencies. We also need to know if — and how — the program being supported by transparency is doing any good.
Using technology to manage a government program is not the same thing as being transparent to the public about how it is managed. At the same time, how technology is used to support a program can affect the program’s transparency.
An important question is whether the costs of promoting transparency do, in fact, increase the likelihood that government programs succeed in accomplishing what they set out to do. At times of fiscal crisis, we need to address the reality that operating a program “transparently” may compete with other program initiatives for scarce resources. We need to understand such tradeoffs.
At minimum, we need to understand what transparency costs as well as who would have to pay for increased transparency.
TRANSPARENCY COMPONENTS
One important key to understanding and measuring the impacts of transparency on a government program is understanding the relationships among the different groups involved. Figure 1 provides a simple model that organizes transparency into two categories, (1) Participants and (2) Transactions.
Figure 1. Transparency Components
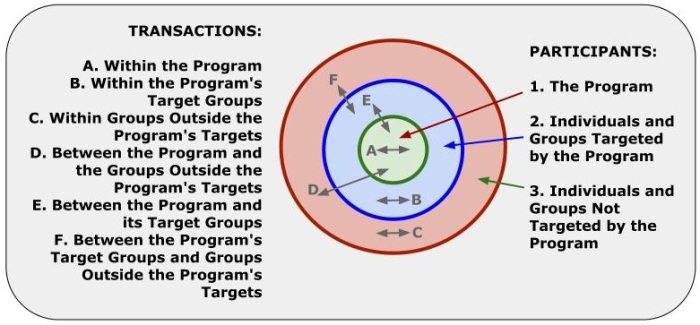
PARTICIPANTS include three main classes:
- The Program consists of the individuals and organizations that are primarily responsible for managing the government program that is the subject of transparency efforts. This might be a project, a department, a legislatively created institution, or some other entity responsible for managing a defined set of government services. Often the program is responsible for expenditures related to performing services and for generating and managing data associated with the program. These data may include descriptions of the service providers and service users, descriptions of the services themselves in terms of costs, transaction type and volume, as well as service impacts.
- Individuals and Groups Targeted by the Program represent the primary focus of the government program, e.g., homeowners, veterans, farmers, manufacturers, school systems, and others. For example, if a program is intended to promote the interests of a particular non-governmental group or industry, we would like to know if spending money on making information generated by the program accessible to that industry is having any impact. One of the complexities here is that government programs frequently work through intermediary organizations that are not directly controlled by the government, such as colleges and universities in the case of veterans’ benefits.
- Individuals and Groups Not Targeted by the Program represent those outside the targeted beneficiaries of the program that may, over time, benefit in some way from the products or services provided by the program. For example, an independent organization such as a publisher or a nonprofit might gather data together generated by multiple government programs, then create a product or service to sell that was not originally anticipated by the legislation that created the original source programs.
TRANSACTIONS represent the sources and targets of data associated with the program:
- A. Within the Program represents data-generating transactions that occur among the people and organizations directly involved in operating the program. These include hours and costs associated with supporting the programs, transfer of information and resources among the program’s employees as they manage the program, and sharing information about the program across internal or departmental boundaries. An example is the rapid sharing of data on citizen inquiries by the different departments responsible for answering questions about program benefits. Better sharing of information about questions and responses across such departments helps ensure consistent answers to questions and a reduced cost in generating responses.
- B. Within the Program’s Target Groups represents the sharing of information and services among members of groups targeted by the program’s services. Redistribution of food and medicine and sharing of information obtained from a government agency with one’s friends and family are examples of such transactions. Such transactions may not be directly controlled or even observed by the program but they might have a measurable impact on the effectiveness of the program. In recent years government agencies have learned that, even though they cannot control the sharing of information about government programs within various social networks, they can observe and participate in ways that may improve the overall experience of users with the program’s services.
- C. Within Groups Outside the Program’s Targets represents the sharing of information about the program by those who are not directly impacted by the program’s services. An example of this would be the aggregation of data about different services received from different agencies by a given target group by an institution interested in “big data analysis” or in the creation of products or services that can be sold to augment the services received by the program’s target groups. Even though such organizations might operate outside the control of the government program, awareness of their actions and what they are doing with indirectly-supplied information from the program will, at minimum, provide the program with insight into the “competitive landscape” within which the program operates.
- D. Between the Program and the Groups Outside the Program’s Targets represents the program’s making information available about the program directly to those who may have an interest in resharing, analyzing, or combining the program’s data with data from other sources in order to provide products or services to the program’s target groups. Should the program incur extra expenses in providing data to such groups even though it may be unclear whether actual benefits will flow back to the program or its constituents? Should the benefits provided by such “third party” services be linked back to the expenses incurred in supporting them?
- E. Between the Program and its Target Groups represents the area that has probably the largest number of variations. It covers getting information about the program’s services to target groups, explaining how the services works, helping them understand what is being provided, and providing enough information to establish a level of trust and confidence in the service being provided. Examples include information about side effects — or the lack thereof — of certain types of vaccinations, data on the costs and budgets of the services being provided, and information about the training and qualifications of those responsible for managing the program. Budgets for programs typically cover the provision of services to the target group and may also take into account the collection of fees for such services.
- F. Between the Program’s Target Groups and Groups Outside the Program’s Targets represents a potential competitive landscape for services targeting the same group. It is conceivable, for example, for a third party group to use program-provided information to support the provision of services to the program’s target groups — but for a fee different from what the program charges (if any). On the other hand, third party groups might be able to exercise more agility in providing services than regulated government agencies, as demonstrated when charitable and religious organizations — organizations that citizens already have relationships with — become “first responders” following a disaster.
Making the types of distinctions just discussed is important given that issues of “who pays” and “who benefits” are critical to assessing the Return on Investment (ROI) of transparency efforts, as discussed by Doug Hadden of FreeBalance in his paper The Real ROI for Government Open Data.
PROGRAM CONCEPT FRAMEWORK
Given some understanding of the individuals, groups, and organizations involved with the program, we should start with a comprehensive view of how transparency programs can be planned, developed, and operated. Shown below is an outline of the concepts relevant to developing a transparency program to improve the visibility of, and access to, data and services provided by government agency programs.
The focus of this model is not just on data about the program but also on the program’s range of processes and technologies.
Figure 2, shown as an embedded graphic and maintained using MindMeister software, is being updated as I learn more about the topic. The original “mindmap” is located here and any changes to it on the Mindmeister site are reflected immediately in Figure 2 here.
Figure 2. Framework of Transparency Program Planning Concepts
FIGURE 2 NOTES
1) Program Objectives
The PARENT PROGRAM is the public program or service that has its own set of objectives, e.g., provide a specific benefit or service to a target citizen or industry group. In this model these basic objectives are defined as LEGAL, SOCIAL, BEHAVIORAL, FINANCIAL, and OTHER. How these are expressed programatically or financially will vary by program with some objectives being defined via legislation.
2) Transparency Objectives
The TRANSPARENCY PROGRAM has its own objectives which should be tied to the PARENT PROGRAM, for example:
- The transparency program shares (or inherits) the objectives of the parent program.
- If one of the objectives of the parent program is to increase awareness of a particular government service among members of a particular group, the transparency program shares this objective.
- The objectives “more/better/faster” listed here are intended to describe the manner in which the transparent program supports the parent program, e.g., does the transparency program help the parent program deliver better service to more people at less cost?
3) Stakeholder Roles
The stakeholder “roles” listed here are the basic RACI formula used for defining the types of relationships different individuals and groups have with any given program or product. The idea is that, for a basic decision or event, the relationship of the person or group with the project can range from being “responsible” to “informed,” for example:
- If one is RESPONSIBLE, the consequences for acting incorrectly or not acting at all can be severe.
- If one is only INFORMED after the fact about a decision or event, failure to perform or perform correctly may not be linked with that individual.
In actual practice, the same individual associated with a program may perform multiple roles and may possess multiple levels ranging from RESPONSIBLE to MUST BE INFORMED. This overlapping of roles needs to be taken into account when managing the program’s transparency related processes.
4) Program Stage
Often different individuals, groups, and roles will be involved in a program depending on whether the program is in the planning stages, is under development, or is operational.The same will be true of the transparency program that supports that program.
5) Metrics
METRICS are the quantitative and qualitative measures we use to determine how — and how well — a given program operates. Ideally we want to understand how the transparency program supports and improves how well the parent program performs so that we can make good decisions about the resources expended on developing and supporting the program’s transparency efforts.
We also want to ensure that the manner in which the transparency program operates is itself effective and efficient. For example, if the program is designed to provide direct financial benefits to target constituents, we may want to minimize the ratio of transparency program and parent program costs to the total dollars transferred to clients.
6) Volume
VOLUME is a quantitative measure of how much work the program performs, e.g., number of constituents helped, number of housing units repaired, pounds of radioactive materials buried, etc.
7) Program Cost
PROGRAM COST is a measure in dollars of the resources expended in planning, developing, and operating the program.
8) Operational Efficiency
OPERATIONAL EFFICIENCY refers to the cost per unit of service delivered by the program.
9) Program Impacts
PROGRAM IMPACT refers to the outcomes generated by the program, e.g., number of individuals housed temporarily in an emergency, reduction in cases of a given disease, improved scores on standardized tests, etc. Impacts can be intended or unintended and also quantifiable or non-quantifiable (e.g., non-quantifiable benefits).
10) Technology
Different technologies can be used to promote program transparency. Here we divide them into two categories:
- ACCESS technologies are those that the user employs to engage with or otherwise use the services provided by the government program.
- HOSTING technologies are those employed by the program to manage the operation of the program’s services.
11) Access
ACCESS technologies are those that the user employs to engage with or otherwise use the services provided by the government program.
12) Hosting
HOSTING technologies are those employed by the program to manage the operation of the program’s services.
13) Transparency Components
What makes a program “transparent”? TRANSPARENCY COMPONENTS address what we mean, specifically, by “transparency” for the program in question. These components may vary from program to program in their detail and may, in some cases, be converted into “use cases” that are used as the basis for testing or system acceptance.
14) Descriptive Information
DESCRIPTIVE INFORMATION means that information about the program and its services are available to the people it is intended to serve. This includes information about changes in the program and how they may impact how the program performs and how its services are managed.
15) Management Identity
MANAGEMENT IDENTITY means that the names, qualifications, responsibilities, and contact information of those responsible for managing the program and its services are available to those the program is intended to serve.
16) Operational Costs
OPERATIONAL COSTS means that the actual cost of resources needed to operate the program are known and available to management, oversight groups, and constituents.
17) Cooperative Management
COOPERATIVE MANAGEMENT means that the different groups or departments involved in managing the program actually cooperate and share information about the program.
18) Performance Statistics
PERFORMANCE STATISTICS means that objective data about program performance (e.g., dollars distributed, number of transactions, contact hours, etc.) are available and updated frequently.
19) Quality Measures
QUALITY MEASURES means that performance quality data (e.g., error rates, user satisfaction, etc.) are collected and published on a regular basis.
20) Multiple Channels
MULTIPLE CHANNELS means that both services and information about the services are available through a variety of appropriate media and channels, e.g., in person, online, by mail, via print and electronic media, etc.
21) Reusable Data
REUSABLE DATA means that data about the program are available both to program operators and to others in a form that can be reused, aggregated, and analyzed in a variety of different ways.
PRELIMINARY RECOMMENDATIONS
Here are some preliminary findings (and recommendations) based on what I have learned so far. Some of these are drawn from Why I’m Uneasy about “Big Data” and Government Programs and are based on my research as well as my own experience managing database related projects and product development work.
- Don’t spend money on converting or standardizing data that are old or out of date. You need to focus on the data that are really useful. Going back in time to convert data will generally impact both your fixed and variable costs. Variable costs will be impacted simply because there’s more data. Fixed costs will be impacted because the farther back in time you go the more likely it is you will encounter special problems associated with different data sources. (Be aware, though, that there may be legal or statutory requirements concerning how long data or the documents containing them must be retained.)
- Start small so that the initial “humps” of data conversion costs and having to operate dual or overlapping systems won’t sink the program. Think carefully about how much data are actually needed to make the transparency program useful. Generally the more you have to convert retrospectively the higher the initial cost will be. Don’t let a massive upfront conversion project sink your customer’s or your client’s willingness to invest.
- Align transparency activities with the programs responsible for supplying and using the data. Eventually you will want to reduce the delay between the time data are generated and the time they are available for access and use. Working with the people responsible for the data will accelerate this process and will also make it easier for you to respond to needed changes along the way.
- Make sure that leadership, operations, and budget are adequate and reliable. This seems obvious, but in the world of government and government services that are delivered through many different layers and levels of different organizations, both public and private, you will have many “moving parts” that need to be coordinated.
- Target critical use cases that generate real benefits to users. Just because something is “easy to do” does not mean that it will be useful. Make sure your efforts focus on answering real questions and solving real problems.
- Avoid an “if we create it they will come” strategy. While I am a firm believer in serendipity and the innovative use of data to create new products and services, I also think it’s necessary to be realistic about what can be generated from data that have been removed from their original source program. You may not be able to count on someone creating a useful or saleable product if you are removed from the data -generating program, so focusing on known markets will enhance the likelihood of positive feedback early on.
- Make sure all stakeholders are on the same page — agency staff, procurement staff, legislators, and most importantly, users. This is just basic project management. You need to keep all of the “moving parts” on the same page and moving in the same direction. Even if not everyone is in agreement with your target strategy, you need to assess the risks associated with key players suddenly withdrawing or changing course in a way that will damage your program.
- Focus program metrics on outcomes, not just internal transactions, costs, and increased program efficiency. Just because something is cheap, reliable, and easy to produce does not mean that it will be useful or valuable to anyone.
- Target mobile devices first for exposing data to different constituencies through creative methods of data visualization and manipulation. The world is going mobile. Consider starting there, not with traditional desktop applications. (See The Link Between Mobile Tech and Government Transparency for more on this topic.)
- Maximize reliance on open source, non-proprietary, and off the shelf tools and techniques. Open-source methods have their own risks, but you don’t want to be beholden to a proprietary standard or license agreement that artificially restricts your ability to respond to user requirements.
Note that the above points do not address more technology-specific considerations such as the role of API’s in access enablement, whether or not realtime streaming of data is needed versus batch access, the role of cloud versus more traditional server farms, and how content and metadata are organized and managed. While it is easy to suggest that how technology is employed should be 100% dependent on an organization’s goals and objectives, the reality is that attaining these goals and objectives are intertwined with current and planned system and content architectures.
Copyright (c) 2013 by Dennis D. McDonald.


